Posts

DLF Anticipated Happened Elliott Wave Analysis

Image
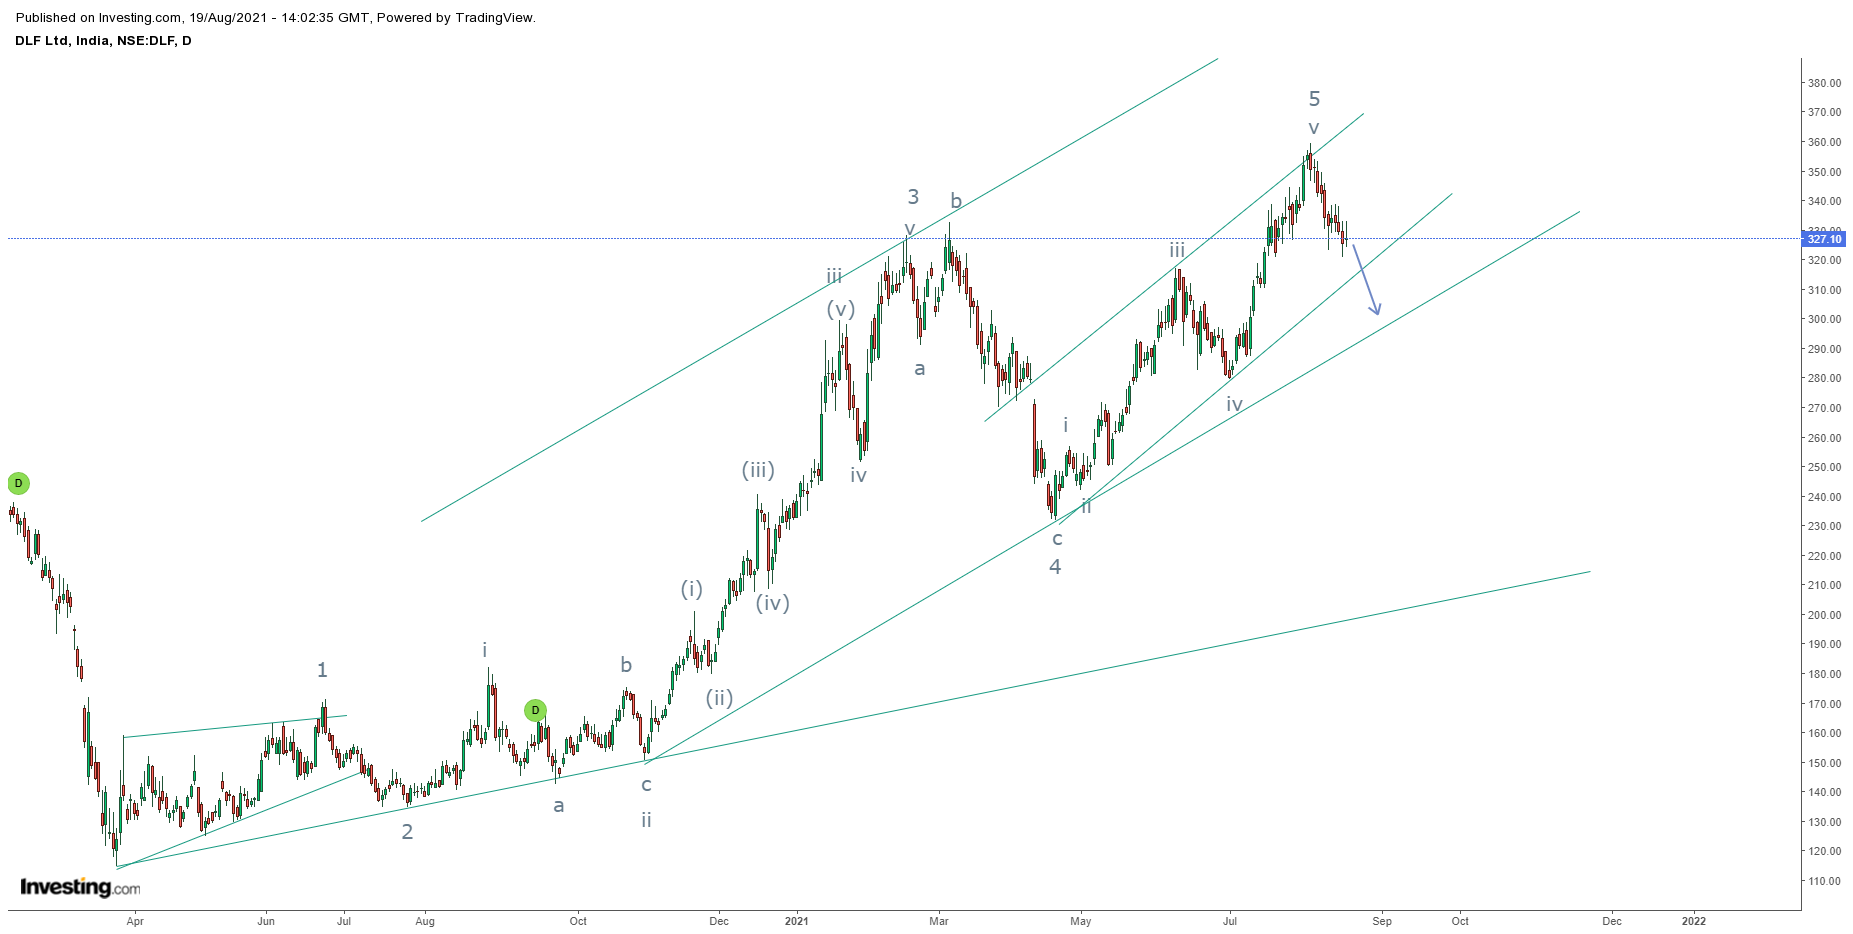
 DLF daily chart anticipated on 19th August 2021 DLF daily chart happened on 20th August 2021 In my previous update on DLF, I had mentioned that, " D LF is expected to dip till 310-305 over short term with resistance placed at 340." The stock faltered and closed at 309 on the last trading day of the week and marked a low of 306.5, thereby achieving my mentioned level in a single day after the previous article on DLF- Anticipated Happened. Please click on the link to see the previous article on DLF  https://www.marketanalysiswithmeghmody.com/2021/08/dlf-elliott-wave-analysis.html The stock has given a bearish break in a rising channel formation and can even sink further now to the next possible support placed at 295-298 levels over short term. The summation is DLF is now weak and can move down towards 298-295 levels in near term.

SHIBA INU ElliottWave Analyais

Image
SHIBA/USD hourly chart As shown in the above chart, the crypto currency is moving in a higher highs and higher lows, but now it is at a challenging terrain where it is difficult to come to a concrete conclusion that where and how it can resume the major trend. I have found out two important supports from where prices can reverse and resume it's uptrend (shaded area). Wave theory suggests, prices have completed an impulse wave and has started corrective wave, either the correction is over, as it is showing resilience or it will move back down in form of wave c to complete (a-b-c) pattern and slump till next shaded region. The summation is, Shiba Inu is near important support, break of $0.0000780 will sink price till $0.0000720. If it stays above $0.0000780 then it can surpass $0.0000950.

DLF Elliott Wave Analysis

Image
DLF daily chart As seen in the above chart, prices are moving in a higher highs and higher lows. However, it seems that the strength is fading away as prices has re-entered the in the terrain of its previous high. If this is a reversal prices will break the small channel within the big one and can test the support of the big channel. From waves perspective, prices have completed impulse move, where wave 1 was a leading diagonal, wave 2 normal correction, wave 3 had extension within extension, wave 4 is steeper as compared to wave 2 and wave 5 marginally crossing wave 3 high. Now correction has started which can drag prices near till 310-305 levels. The summation is DLF is expected to dip till 310-305 over short term with resistance placed at 340.

EURINR Elliott Wave and Neo Wave Analysis

Image
 EURINR hourly continuous chart As shown in the above chart, prices have completed the most complex correction after forming the top. This means that correction is still ongoing and it can now move even further, as lower highs and lower lows are intact on short term time frame. Wave theory suggests that, prices have completed wave a in a Neo Wave diametric pattern followed by wave b up in a complex structure and now it is moving down in wave c in impulse fashion. This wave c can now test 85.5 over short to medium term. The summation is EURINR is negatively poised and can sink towards 85.5-85 levels over short to medium term.

MCX Aluminum Elliott Wave Analysis

Image
 MCX Aluminum hourly continuous chart Prices has been moving in a positive formation as it is trading above the rising trend line along with that its previous highs has been crossed decisively.  However, as per advance technicals, Wave theory suggests that prices can test its previous low. The entire upmove is corrective in nature and the recent formation looks more like a irregular flat pattern. In which it has completed wave and wave b and wave c has already started. This means wave c can entirely retrace wave b placed at 203-202 levels. The summation is MCX Aluminum can dip near till 203-202 levels over short term.

MCX Zinc Elliott Wave Analysis

Image
 MCX Zinc hourly continuous chart As shown in the above chart, MCX Zinc is moving in a higher highs and higher lows. However, the base metal has broken its previous low which opens negative possibility for this counter. It is very obvious, that Zinc prices will now sink near to its cluster of supports. From Waves Perspective, prices are moving in a double correction as of now where after completing the second correction, it has now entered in a correction mode. This correction can be the end of the previous upmove or can convert into triple correction, for this it is imperative to monitor the move. For very short term, a fall is inevitable. As wave c of the current correction can plunge prices near till 244 levels. The summation is MCX Zinc is negatively poised over short term and can test the level of 244-243 levels.

Ripple (XRP/USD) Elliott Wave Analysis

Image
 XRP/USD daily chart From the above chart, prices are moving in a sideways pattern as it trades in a range of $3.60-$0.40.  In June 2021, prices tumbled and tested the lows as mentioned above and in current month  strong bounce back is seen in this crypto currency. As par Wave theory, prices have completed wave 1 followed by wave 2 down in corrective pattern. At present it is moving in wave 3 wherein currently it is moving in wave (iii) of wave iii, so it is very clear that it is an extension within extension. The Summation is Ripple is likely to test $3.60 over short to medium term as far as $ 0.40 is intact on the downside.