Posts

BEL Elliott Wave Analysis, Running Triangle

Image
 BEL half hourly chart From the above chart, prices are moving in a sideways direction where two trend lines are converging, thus giving an indication that prices are moving in a narrow range. The narrow range can be seen as a triangle pattern that too symmetrical one but the catch is it is running triangle.  From waves perspective, prices are moving in wave b where it has formed running triangle pattern where wave b is bigger than wave a of the pattern. This pattern is complete and prices are set to open wave c higher. The summation is prices are set to surge till 190-192 levels over short term as far as the level of 179 is intact on the downside.

MCX Zinc re-visited with Neo Wave Diametric pattern

Image
 MCX Zinc hourly continuous chart anticipated on 7th July 2021 MCX Zinc hourly continuous chart happened on 9th July 2021 In my previous update on MCX Zinc dated 7th July, I had mentioned that, " Zinc is in positive terrain and can move higher from current levels till 244-245 levels over short to medium term." Prices did not reach till 244-245 levels but it made a high of 243.6 which was close to my mentioned level. Also it was achieved in a very short span of time- two trading sessions. Here is the link of my previous article on MCX Zinc dated 7th July 2021 https://www.marketanalysiswithmeghmody.com/2021/07/mcx-zinc-elliott-wave-analysis.html The best part of this chat is prices formed Neo wave diametric pattern in wave b which I anticipated that it was a flat pattern. Neo wave Diametric Pattern comprises of seven legs (a-b-c-d-e-f-g) and then wave c is clearly seen, which was anticipated by me.

Tata Steel Anticipated Happened and Elliott Wave Analysis

Image
 Tata Steel daily chart anticipated on 30th June 2021 Tata Steel daily chart happened on 12th July 2021 In my previous update on Tata Steel dated 30th June 2021, I had mentioned that " Tata steel is positively poised and can move higher from current levels and can test 1250 levels followed by 1280 levels over short term." Today prices opened at 1254 levels thus achieving my first target for the steel stock thus, gaining 6.30% in span of 7 trading sessions - Anticipated Happened. To read the previous article on Tata Steel click on the the below link https://www.marketanalysiswithmeghmody.com/2021/06/tata-steel-elliott-wave-analysis.html Now my second target is still pending which can be achieved in coming trading sessions thus completing wave (iii) followed b wave (iv) and wave (v), thus completing wave v in extension within extension. I will monitor this stock and keep updating, but one thing is sure that the stock still has upside left.

Bitcoin Elliott Wave and NEO Wave Analysis

Image
 Bitcoin daily chart From the above chart of BTC, prices are slumping from the top and currently the angle of the fall is shifting from 90 to 45 degrees which is an indication that prices are on the brink to change the trend from negative to positive. As per Wave theory, prices faltered after ending diagonal pattern but at the bottom there is a reversal pattern happening which is Neo wave diametric pattern. In this pattern there are seven legs (a-b-c-d-e-f-g), in this case it has completed wave f and will move down last leg in form of wave g. Once it is over, prices will move higher towards $44500-$44700 levels. The summation is prices can test the level of $30000 over short term followed by $44500-$44700 levels over medium term.

Gail Elliott Wave Analysis, Expanding diagonal, Irregular flat

Image
 Gail daily chart As shown in the daily chart, the rising trend line which was acting as a support is now broken, thus opening negative possibilities. However, there is no discontinuation of the positive formation which only price can give over a time. From waves perspective, prices have move up in a corrective pattern (a-b-c) where wave c ended up in expanding diagonal pattern, followed by wave b at one larger degree where it is suppose to complete in irregular pattern. Wave b of wave b has surpassed wave a which opens irregular flat pattern. Now wave c of wave b is pending which can test the lows of wave a of wave b. The summation is, prices are suppose to plunge till 130-132 levels with the resistance at 157 levels (closing basis).

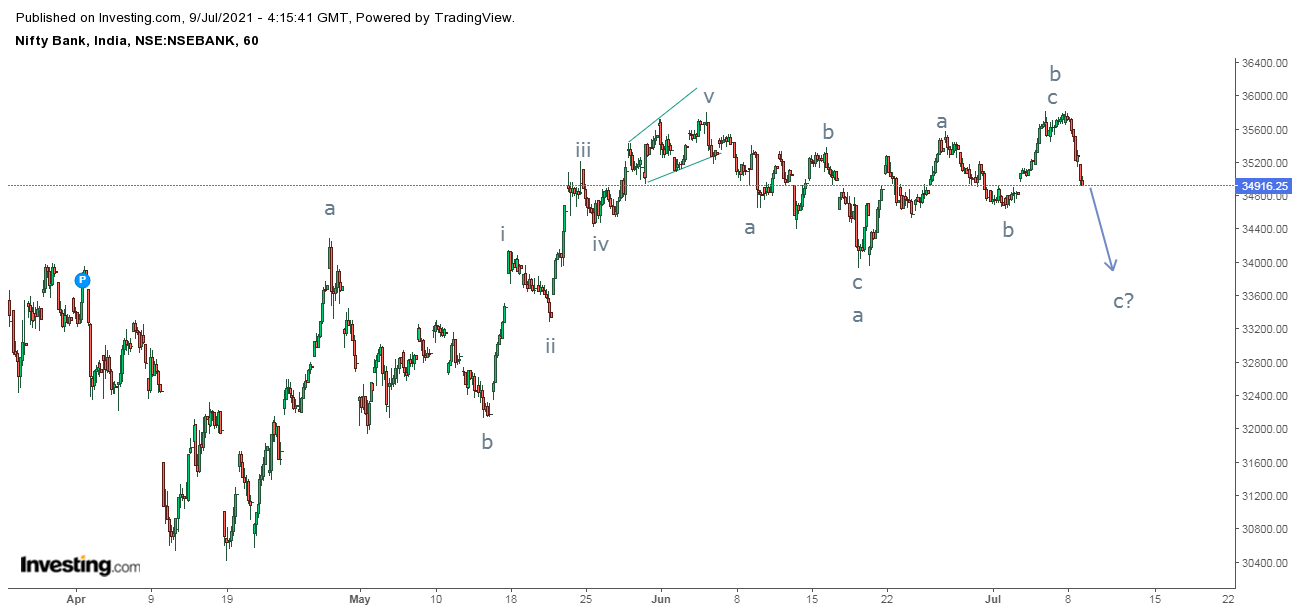
Nifty Bank Elliott Wave Analysis

Image
 Nifty Bank hourly chart As shown in the above hourly chart, Nifty Bank is moving in a range of 2000 points from 36000 to 34000. Recently it faced the resistance of 36000 and today it has shown signs of correction which can drag prices near to the support placed at 34000. From Waves perspective, prices are moving in a flat pattern where wave a and wave b is over and wave c has started which can go slightly below wave a end placed at 34000.  The summation is Nifty Bank is negatively poised for short term and can test 34000 in couple of trading sessions.

US 10 year yields Fundamentals and Technicals

Image
 US 10 year yields daily chart As seen in the above daily chart of US 10 year yield, prices are moving in a lower highs and lower lows and the angle of the trend line is also changing as steepness has been intensified. However, the previous formation in the chart looks to be like a rounding bottom or a inverse cup and handle pattern, right now the correction can be the handle which can drag prices close to 1.05 where 50% of the retracement is placed. Fom Wave theory, prices are moving in wave b at one higher degree which can drag prices lower following that wave c will start surpassing the resistance of 1.78-1.80 levels. Fundamentlly, FED minutes and the data coming from US in the month of June indicates that the economy is doing quite well and tapering the bond purchase can be stopped soon enough, this means it can be next year and the rate hike can be seen next year or at the end of 2023. Hawkish stance is been taken by many FED officials which will take prices way higher but now pri