ACC Elliott Wave, Impulse wave, Ending Diagonal
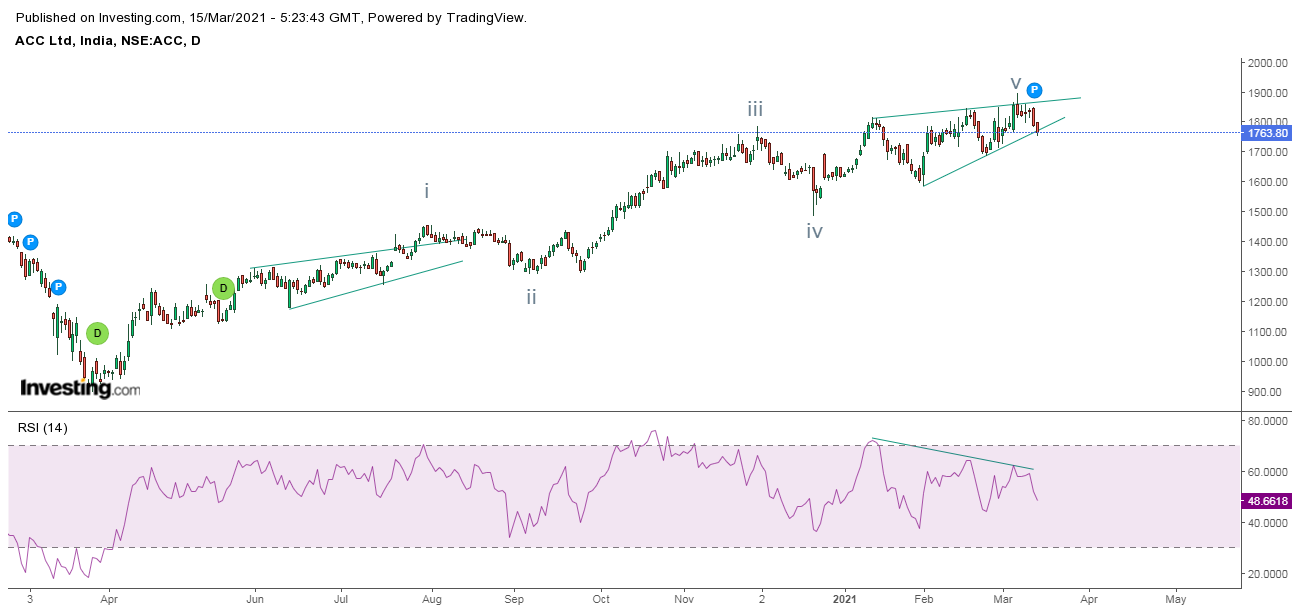
ACC daily chart From the above daily chart of ACC, prices are moving in a higher highs and higher lows which clearly indicates that the trend is firmly positive. However, prices are moving in a distribution pattern which is known as rising wedge pattern. The pattern is accompanied by negative divergence in RSI indicating halt in positive momentum. From Waves perspective, the stock is moving in an ending diagonal pattern which arrives in wave v. Thus opening the possibility of correction. Prices are set to dive in coming trading sessions near about 1640. Manually counting waves is difficult task, but with the help of proper application of theory put into practice you can not only count but forecast with me in my one month exclusive webinar. The webinar is all set to start from April 2021, the details are mentioned below. Learn Technical Analysis in our 4 month course to help you to identify better trade setups. This course will be conducted every twice in a week for around 2 hours. Th