Posts

Bank Nifty (Elliott Wave Analysis)

Image
Daily Chart of Bank Nifty From the above chart of Bank Nifty, it is visible that prices are moving precisely in a rising channel by forming a higher highs and higher lows which is a positive formation. As far as prices persist in this channel, the bias will remain positive. Technical indicator RSI as shown in the chart has relieved from the overbought zone and can resume the uptrend soon. As per Wave perspective, the channelized move is an impulse wave, in which wave iii is either ongoing or it is over. It can also be extended or can be an extension within extension. However it is early to jump to the conclusion. This means wave iv and wave v is still pending. In short, the bias is positive and prices can test 29000 or above that in near to medium term with the crucial support of 27500.

EURUSD: Resumption of downtrend

Image
EURUSD EURUSD is moving down in an impulse fashion. Recently it has completed wave iv after extended wave iii, thus opening the possibility of wave v on the downside which can tumble prices till 1.150 or even lower. However, wave v can also be a failure, particularly known as truncation. So I will be bearish for this pair with the support at 1.150 and if it is broken then acceleration of downtrend will continue. In short, expect prices to stumble close to 1.150 in near term.

USDINR: Correction on the way

Image
USDINR Daily chart From the above chart USDINR has completed five waves on the upside, thus opening the possibility of a correction which can drag prices near till the immediate support. The supports are now placed at 68 followed by 67 which is the support of the trend line. I think all these support will be broken in near term or in medium term. From wave perspective, after completing an impulse wave, a corrective wave of a higher degree is likely to follow which can take prices till 68 followed by 67 over short to medium term.

MCX Gold set to slide (Elliott Wave Analysis)

Image
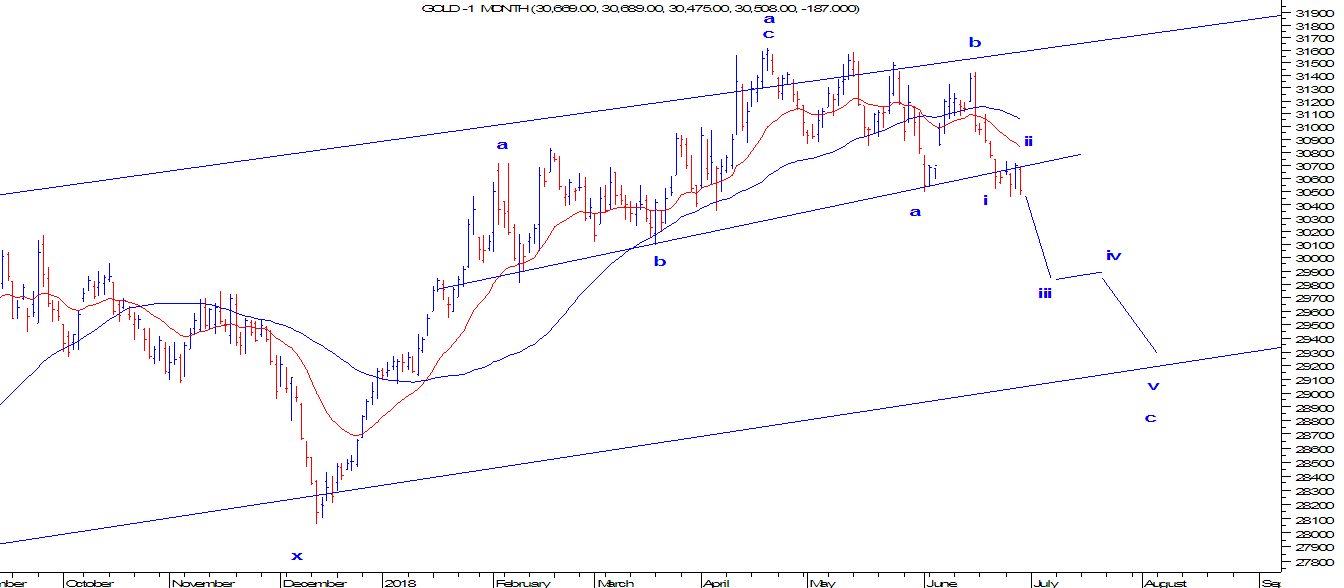
MCX Gold (Daily Continuous contract) From the above chart of MCX Gold, it is very clear that the trend is now negative as prices reversed from the channel resistance and is now moving in a lower high and lower low formation. Prices also formed a topping process by making a bearish Head and Shoulder pattern. This pattern is completed as the neckline is breached, placed close to 30,700.At present, the yellow metal is hovering near the neckline and can move down from current juncture. As per wave theory, prices is set to move down in one higher degree of wave b in which it has completed wave a and wave b. So the possibility of wave c is open on the downside which is impulse in nature or it can end up in a diagonal. In short, MCX Gold is set to dip near to 30,000 followed by 29500 where the channel support is placed over short to medium term.

USDINR: To halt its rally?

Image
Daily Chart From the above daily chart, USDINR seems to have halted its current rally which can possibly lead to profit booking dragging prices lower. As of now it is trading below short term moving average of 20 EMA (Red). From Wave perspective, prices are moving down in a double correction (a-b-c-x-a-b-c). Currently it is trading near the resistance of the small channel where wave x will be completed and wave a will start followed by wave b up and eventually wave c down. In short, prices will tumble in near term close to 66.7 over short term. However, any move above 67.6 will negate the downside target, so it will now act as a crucial resistance level. Learn Elliott Wave and Neo Wave on 23rd and 24th June. Learning the Wave theory will help to identify the reversal points well before the market does. "Don't follow the crowd blindly, think objectively". The session is a two day session which will be a webinar and the costing will be 10,000/- for two da

Nifty: Expected to test 10900-11100

Image
Daily Chart From the above Daily chart of Nifty, prices are moving higher in a rising blue channel and currently trading above both the short term moving averages 20 EMA (red) and 50 SMA (blue). A bullish crossover is also seen from these moving averages. RSI on the daily chart is above the center line, thus opening positive possibilities. The blue channel is drawn to understand the resistance for this index. However, the first resistance will be around the previous peak which is 10900 levels followed by 11100 levels. From Wave perspective, the previous downfall was a three wave structure, the current up move can be a three wave or an impulse. So I have marked i/a followed by ii/b, currently the ongoing leg can be wave iii or wave c. In short, Nifty is poised to soar near till 10900 levels over short term. Sustainable move can drive it further till 11100 over medium term. Learn Elliott Wave and Neo Wave on 23rd and 24th June. Learning the Wave theory will help t

MidCap stocks to rally further?

Image
Midcap Daily Chart Midcap stocks are positively poised at current juncture. From wave perspective prices tumbled in a three wave structure (a-b-c) and then changed the direction from negative to positive which I think will also be a three wave structure (a-b-c). The overall trend looks firmly bullish soaring prices to its all time high. In short, the index will rally further pushing prices higher till 21500-21700 levels in near term.