Posts

MCX Copper: Elliott Wave analysis and forecasting

Image
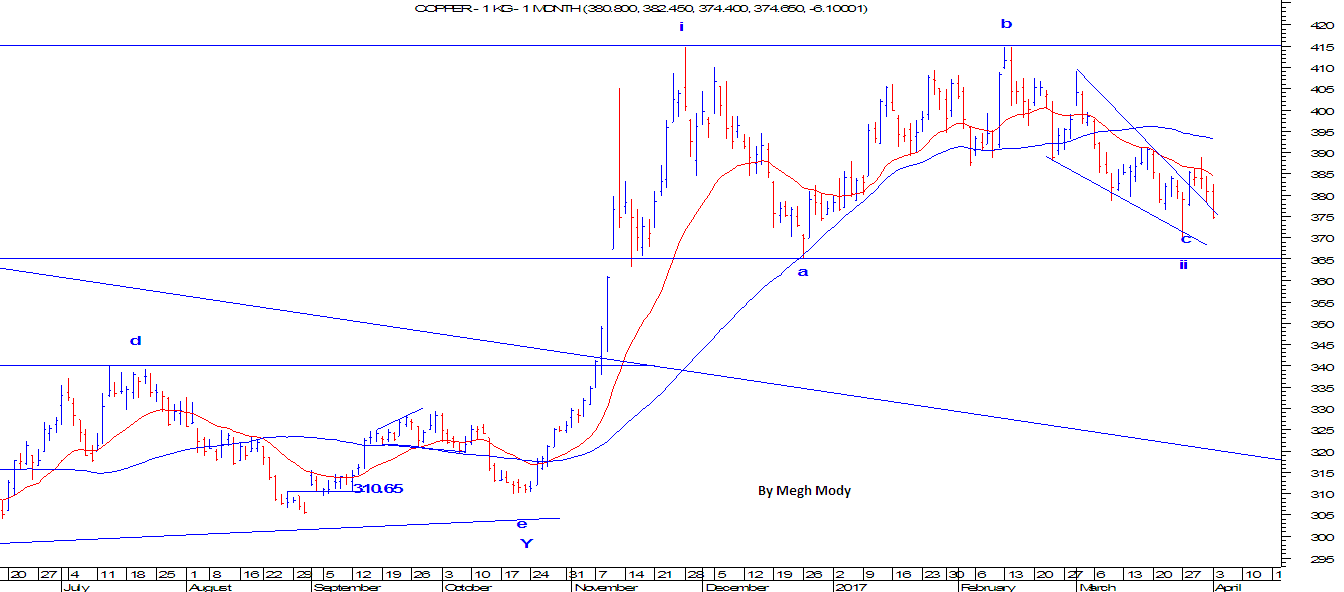
MCX  Copper (Continuous Daily chart) MCX Copper last year made a high of 415 and formed a base close to 365 levels, thus giving an indication that the firm downtrend is over and prices are now set to start a positive trend. The downtrend was ended in the month of November 2016 after breaking the downward sloping blue channel. As per Wave theory, after steep rise from 300 to 415 levels, prices are in the making of Flat pattern (3-3-5). As of now it seems that wave c of the flat pattern is over and prices are set to resume the uptrend. However, break of 365 will open other possibilities, which can eventually turn into another pattern. In short, as far as 365 is protected on the downside the bias is positive for MCX Copper as it can surpass 415 levels in near term.

MCX Crude Oil on the brink to reverse

Image
MCX Crude Oil Daily continuous chart The benchmark WTI crude oil, in the last month of last year rallied and crossed the level of $55 per barrel after OPEC and Non- OPEC members agreed to cut down the production. However, in the following month the inventories suddenly spiked up despite the measures taken, thus making Crude oil vulnerable. After the events occurred, prices were moving in a range of $53-$55 per barrel and it continues to remain so, but how long? MCX Crude showed massive gains last week when it crossed 3700 levels but it was short lived as it reversed on the same day, thus showing loss of momentum by buyers. The overall picture indicates that the resistance is now fixed at 3700 levels. Technically speaking, prices has not discontinued the higher high and higher low formation. It is also above both the moving averages (20&50), giving an indication that the trend is positive. However, MACD has given a sell signal and RSI have started falling. As pe

MCX Nat Gas: Impulse or Zigzag?

Image
MCX NatGas Daily Continuous Chart MCX Natural Gas is outperforming from the start of this year. Price continues to move in a positive direction forming a higher high and higher low. Moving averages are also moving higher indicating that the trend is firmly positive. From late March 2016 prices started moving in an impulse fashion and completed either wave 1 or wave a at 225 levels. Thereafter the counter trend was a 3 wave structure and was also within 61.8% of wave a. Here the possibility of Zizgag is open. The possibility of impulse wave 3 is also likely only if wave 4 does not overlap in the territory of wave 1 which is 225.  As per Zigzag wave c, which is ongoing is almost on the verge of termination as it has gone till 100% projection of wave a to wave b. Any move below 225 will confirm that it is a zigzag pattern. However, if prices continue to remain above 250, then the possibility of 350 is likely. In short, expect prices to reverse and move down till 2

MCX Nickel: Hovering near resistance

Image
MCX Nickel Daily Continuous chart From the above daily continuous chart of MCX Nickel, it is visible that prices are consolidating near the resistance of the upward sloping blue channel. However, prices are trading above both the short term moving averages 20 EMA (red) and 50 SMA (blue) but the momentum seems to be slowing down. RSI on daily chart has exhibited negative divergence and MACD has already given a negative signal by crossing the signal line from above. Looking from wave angle, prices after completing wave a at 816 in the month of November 2016 fell sharply for three consecutive sessions followed by a rise which is still intact. As of now it is possible that the first wave will be a flat structure as the ongoing wave has retraced more that 61.8% of wave a which was a three day fall. The possibility for the ongoing wave to cross 800 is likely and can also test 816. After testing or crossing 816 to a certain extent, expect a steep fall which can drag prices

What is Mono Wave? How to identify it?

Image
Mono wave is a term used in Neo Wave analysis. As we all know that Neo Wave is the filtered version of Elliott Wave analysis. It is the most objective approach to identify waves and patterns. Lets not jump on patterns for the moment and first identify monowave (m). A wave pattern which changes price direction is known as (m). For example: The wave in the box is a mono wave as it changed the direction. The first downfall and the second downfall in the above chart can also be termed as a (m). There are more versions of (m). A (m) can move up or down in a straight line or cannot move up in a straight line. A decisive change in price direction will give a clear picture of (m). For example:

MCX Aluminium to shed some recent gains

Image
From the below chart of MCX Aluminium, it started its upward journey after forming a bottom in October 2015 and thereafter it is moving precisely in a rising channel formation, this gives an indication that the trend is positive. Moving averages are also showing positive action. However, prices have arrived near the resistance of the channel which can eventually lead to a short term reversal. As per wave patterns, it is clearly visible that prices are as of now moving in a double correction (a-b-c-x-a-b-c). At current juncture it has completed or in a process to complete wave a of the second correction. Wave a can also exceed till 120 - 121 levels. Following there has to be a good reversal which will start wave b on the downside. In short, expect prices to move down till 110 levels for short term. The major trend will continue to be positive as far as prices persist in the rising blue channel.

SBI: Head and Shoulder, Neo Triangle

Image
SBI was forming a topping process from the month of August 2016 till November 2016. The topping process ended in a head and shoulder formation supported by volume. The left shoulder was accompanied by heavy volume but as the pattern started forming the volume receded. The level of 245- from where prices have bounced couple of times was breached, giving an indication the lower tops are in place. Short term moving averages have given a bearish crossover which supports my above mention view. As per wave analysis, prices formed a extracting triangle at the top and then moved down thereby ending wave y at the top. One complex correction was ended from the bottom to top and now its correction will start on the downside. As far as prices don't move above level of 256, the bias will remain negative for this banking stock. According to H&S pattern, prices can touch the level of 220. SBI Daily Chart Disclaimer: The above content is not for trading perspective. Plea