Posts

Reliance Power: Trading with Elliott Wave

Image
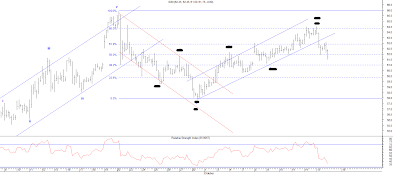
Shares of Reliance Power were buzzing in trade on Friday as it gained 3 percent intraday. Sources said that CBI is likely to close its preliminary enquiry to probe coal block allocation in Reliance Power ’s Sasan project. Sasan power project is an ultra-mega power project with an installed capacity of 4000 MW. The first unit started producing power on March 30 while the second unit started production on December 13. The company's overall generation capacity has crossed 3,200 MW. Reliance Power is executing three UMPPs in Sasan (Madhya Pradesh), Krishnapatnam (Andhra Pradesh) and Tilaiya (Jharkhand). Does news really drive the stock prices or it is the advance technical study that has made aware that the trend is changing.  Reliance Power Daily Chart From the daily chart of Reliance Power, from past 4 months this stock is moving in a range of 80-66 levels. Recently it bounced from the level of 70 and it is capable in moving up till …. levels which is a very good resi

Sun Pharma: Trading with Channels

Image
We have always given emphasis to channels, as they play very significant role in determining resistance and support levels. Channels are categorized into 2 types ·          Rising channel ·          Falling channel Rising channel occurs when prices are moving up by forming higher highs and higher low formation. This means that whenever, prices protects its previous low and crosses its previous high, rising channel can drawn by joining two highs and two lows. Falling channel can be drawn when prices starts breaching its previous low and forms a lower high. This means that prices are moving in a negative direction. Connect two tops and bottoms to from a downward sloping channel. Daily Chart Analysis From the daily chart, we can observe that prices are moving lower by breaching its previous lows and it is moving precisely in a falling red channel. The stock has a very good support near 560 levels which is the upward sloping blue trend line of rising blue

Larsen and Toubro Elliott Wave Counts and the forthcoming trend

Image
Larsen and Toubro is a capital good stock which has gained tremendously in past 2 weeks. However, this stock witnessed profit booking from last 4 trading sessions. It is difficult for many investors and traders to know when to buy and when to sell? By using perfect technical tools and combining it with advance technical analysis, it will be easy not only for investors, traders but also for learners. By saying perfect technical tools is by using channels, channels always help to identify resistance and support levels, while advance technicals like Elliott wave analysis helps you to understand the forthcoming trend. We have applied it on Daily chart on Larsen and Toubro Analysis As shown in the daily chart, the stock started moving lower after making high of 1154 on 9 th December 2013. It fell so steeply that currently it has arrived near the support of the blue channel. The overall trend remains negative but we will be more bearish after it breaches ….. level.

Maruti Suzuki Elliott Wave

Image
Maruti Suzuki is one of the out performer  auto stock just like Tata Motors, Bajaj Auto etc. The trend still looks to be positive but on 12th December 2013 the stock started correcting. It seems that it will change the trend as well. Such kind of movement is difficult to trade but with the help of Elliott wave counts it is easy to identify the reversals. The following excerpt is been picked from our daily research report "The Equity Waves" where we have shown the possible reversals and Elliott wave counts. Maruti Suzuki Daily chart As shown in the daily chart of Maruti Suzuki, currently the stock is moving up by forming higher highs and higher lows which is a positive sign for this auto stock. However, the stock has arrived near the resistance of the channel. RSI has also exhibited negative divergence. As seen in 60 mins chart, .......................... From wave perspective, prices have probably completed wave c of double correction (a-b-c-x-a-b

Identifying Zigzag Pattern

Image
The big picture of Elliot wave is a five wave structure followed by 3 wave structure. In this educational article we have tried to show our readers how simple zigzag pattern looks and what internal structures does it have? A zigzag pattern in Bull market has a 3 wave structure (a-b-c) in downside, as soon as the third wave is complete it will start its next leg on upside. The internal waves of each three wave are (5-3-5) which will complete one zigzag pattern. A zigzag pattern in a Bear market has a 3 wave structure (a-b-c) but here it is on the upside. Once the third leg on the upside is over it will start moving lower. The internal waves of each three leg are (5-3-5) which completes one Bear market zigzag pattern. It is occasionally observed that Zigzags occur twice or thrice at succession. This happens when one zigzag pattern falls short of its target. In this case each zigzag is separated by one more wave, after completing that wave again zigzag pattern will start w

IDBI: Channel Break out and Elliott Wave Counts

Image
IDBI Bank comes under the head of NSE Midcap 50. On Tuesday, NSE Midcap 50 was down by 1.46% which was the highest fall as compared to past 6 days of trading. On October 09, 2013 IDBI Bank offered Home loan and Auto loan on Base rate which is currently at 10.25%. It has also decided to waive the processing fee for both House loan and Auto loan during this period. All these factors indicate positivity for this stock, if this was the case why IDBI Bank could not perform? Using combination of simple technicals like channels, retracements etc and advance technicals like Elliott Wave counts we were very accurate in mentioning the level of IDBI Bank as it could move till 64-64.50. On Monday, 14 th October 2013 IDBI made a high of 64.50 and reversed. We have now further analyzed the movement of this stock using the combination of technical study IDBI 60 mins chart Analysis From the above 60 mins chart, we can say that IDBI bank has bounced from 58 odd levels and

Bank Nifty : Elliott Wave counts

Image
Bank Nifty : Anticipated Happened Bank Nifty showed some good strength especially when it crossed   9220 levels in the early October 2013.   Many of the analysts were negative on this index, but as soon as the important pivot high was crossed things changed. We had covered Bank Nifty in our daily research report “ The Equity Waves” publised on 11 th October 2013.   In which we had told to our subscribers the cluster of resistance where Bnak Nifty can reach in coming trading sessions. The below excerpt is been picked from our research report as on 11 th October 2013. Bank Nifty 120 mins chart Anticipated and Happened on 11 th October 2013 Analysis From 120 mins chart, the index after breaking the downward sloping red channel gave a bullish break and started moving up by protecting its previous lows which is a positive sign for this index. Currently, the index is moving precisely in an upward sloping black channel. 2 days prior it bounc