Posts

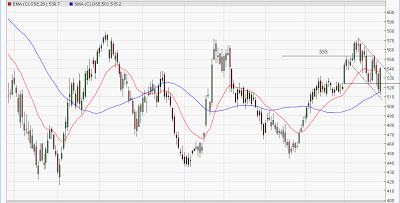
Nifty Retracement and Moving Averages along with Wave counts

Image
In our previous update we had mentioned  that move below 5880 will drag markets to 5820 over short term. Nifty on Thrusday shed gains with almost 100 pts and made a low of 5836 on Friday after failinf to cross 5970 on Wednesday. We had also mentioned that Nifty will come down to 5600 over medium term till February 28 or till March 02, 2013 which is the post pattern target. Now the only concern is the entire fall after the pattern breakout was corrective. For the target to achieve it should be an impulse move as it has to be in sync with time. Moving averages work very precisely in trending market. We are using 20 and 50 days moving average and we witnessed a bearish crossover as 20 day moving average crossed 50 sma from above which has turned the short term trend from positive to negative. Currently markets are hovering on the support of 100 sma, for a medium term trend to be bearish 50 sma and 20 sma need to cross 100 sma from above. We have taken retracement levels from w

Nifty will not respect BULLS

Image
In our previous update we had mentioned that Nifty will move lower till 5700-5650 which is intact over medium term. As seen in the Daily chart , after giving a bearish break in a rising channel pattern, Nifty re-tested the lower trend line of the rising channel and made a Evening star (candlestick pattern) on 13th February and gave a confirmation by opening with gap down the next day. Currently Nifty is below both the Moving Averages. Short term moving average 20 EMA is on the brink to give a bearish crossover by cutting the 50 SMA from above which will confirm that the trend will be Bearish over medium term and  will drag down broader markets to our above mentioned target of 5600 over medium term. Now 5970 will act as a strong resistance as Nifty continue to hover below the lower trend line of the rising channel. A move below 5880 (closing basis) can pull prices lower till 5820 over short term. As per wave perspective, after completing wave v of wave 5 near 6112  prices m

Nifty to test 5700-5650 over medium term

Image
Anticipated on 3rd February 2013 Happened on 9th February 2013 We had mentioned in our previous update, " Nifty will now move lower and can test 50SMA which is placed at 5900 and lower trend line of the rising channel over short term." - Bang On!! After giving a bearish breakout in a rising wedge pattern prices moved lower as per our expectations and achieved our mentioned target. Nifty not only touched 5900 mark but closed below the lower trend line of the rising channel which was earlier acting as a crucial support. Nifty is quoting below 50 SMA for the first time after making a top at 6112 and it is imminent that there will be a bearish crossover of 20 EMA and 50 SMA soon which will infuse more selling pressure. In an Ending Diagonal Pattern prices retrace faster up to 1/4 to 1/2 the time taken for the entire pattern to form. So by the end of February, Nifty might test 5700-5650 or even lower till 5600. As per wave perspective, prices

Nifty Elliott wave counts and its Target over short term

Image
Nifty has given a break of an Ending Diagonal Pattern on Friday by closing below it s previous low thus shedding around 50 points. This suggest that down trend is on stealth and broader markets will now lose its charm. Indicators like MACD is in a sell mode and is moving in sync with the index. Momentum Indicator RSI faced the resistance at 70 and lost its strength, supported by multiple of negative divergence thus indicating that upside is capped. ADX has turned from 40 and -DI has crossed +DI from below which suggests negativity. Nifty is currently below 20 EMA which changed the short term trend from bullish to bearish. From wave perspective, in an Ending Diagonal pattern (Wedge) wave 4 will always enter in the territory of wave 1 which has happened in this case. Currently market has closed below its previous low which has not happened from past one month. The post pattern implication will be a 5 wave structure on downside and will retrace 50% faster of wave 4 of wave 5. Sm

R INFRA and R CAP overview

Image
Reliance Infra: Reliance Infra bounced from 50 SMA and closed above the previous day high gaining about 4% on Friday. The overall trend looks to be negative as the stock is making lower high and lower low formation. R infra has given a bearish breakout of cup and handle pattern on Thrusday. Now it is very important for this stock to remain in a range of 555-530. A decisive move above 555 will open up positive possibilities and stock can move upto 570. As per wave perspective, the stock is moving in a corrective fashion and started 3 wave i.e simple zigzag on downside (a-b-c). Now it is very important for this stock to remain in the downward channel for next two days which will resume the downtrend.  A move below 520 will suggest that it has formed double zigzag (a-b-c-x-a-b-c). In short, expect R infra to hover near the resistance of the upper trend line of the falling channel. Move above 555 will change the trend and move below 520 will be the sign of resumption o

USDINR failed to cross its previous high

USDINR USDINR is moving sideways direction for almost a week within a range of 55.60-54.20. It is very essential for this pair to give a break on either side of the extremes to give a clear direction. Prices failed to cross its previous high and faced the resistance of 61.8% retracement of previous down move (56.50-54.20). The currency pair opened at 55.38 made a high of 55.48 and closed below the open price, thus eradicating all gains. As per wave perspective, prices a forming a simple correction (a-b-c) as price completed wave A at 54.20 and is moving lower, a break below 55 will confirm that wave B is ongoing. In short, our bias is negative USDINR as it will come down to test its lower extreme of the range placed at 54.50. EURINR EURINR bounced back form the lower trend line of the rising channel. The overall structure is positive as the currency pair is forming higher high and higher low. EURINR took a support at 61.8% retracement and managed to move above 72.30 whic

Nifty to start a new rally after crossing 5950...

From past nine months after making an important pivot low of 4770 prices started to form higher high and higher low which is a health sign and precisely moving in a rising channel. The overall structure looks positive for Nifty and can move higher from this levels. Nifty resisted to 5950 for many trading sessions and opened with a gap up, thus crossing the important level of 5950. Now 5950 followed by 5840 will act as an crucial support for Nifty to achieve 6150 level. Again minor supports are  placed at 5980 levels which can be utilized as a stop loss for intraday trading. Nifty opened with gap up for consecutive 2 days and moved in a sideways direction in the entire day. This was previously happened in April 2011 where Nifty opened with a gap up twice and moved up more than 500 points. Moving Averages  20 EMA and 50 SMA is positively poised  as 20 EMA is still above 50 SMA. Momentum Indicator RSI has exhibited negative divergence and we are cautiously positive for Nifty. Any m