Posts

R INFRA and R CAP overview

Image
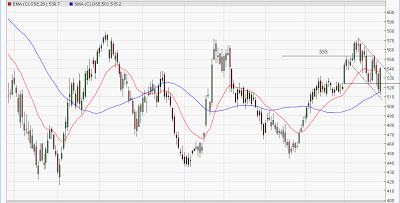
Reliance Infra: Reliance Infra bounced from 50 SMA and closed above the previous day high gaining about 4% on Friday. The overall trend looks to be negative as the stock is making lower high and lower low formation. R infra has given a bearish breakout of cup and handle pattern on Thrusday. Now it is very important for this stock to remain in a range of 555-530. A decisive move above 555 will open up positive possibilities and stock can move upto 570. As per wave perspective, the stock is moving in a corrective fashion and started 3 wave i.e simple zigzag on downside (a-b-c). Now it is very important for this stock to remain in the downward channel for next two days which will resume the downtrend.  A move below 520 will suggest that it has formed double zigzag (a-b-c-x-a-b-c). In short, expect R infra to hover near the resistance of the upper trend line of the falling channel. Move above 555 will change the trend and move below 520 will be the sign of resumption o

USDINR failed to cross its previous high

USDINR USDINR is moving sideways direction for almost a week within a range of 55.60-54.20. It is very essential for this pair to give a break on either side of the extremes to give a clear direction. Prices failed to cross its previous high and faced the resistance of 61.8% retracement of previous down move (56.50-54.20). The currency pair opened at 55.38 made a high of 55.48 and closed below the open price, thus eradicating all gains. As per wave perspective, prices a forming a simple correction (a-b-c) as price completed wave A at 54.20 and is moving lower, a break below 55 will confirm that wave B is ongoing. In short, our bias is negative USDINR as it will come down to test its lower extreme of the range placed at 54.50. EURINR EURINR bounced back form the lower trend line of the rising channel. The overall structure is positive as the currency pair is forming higher high and higher low. EURINR took a support at 61.8% retracement and managed to move above 72.30 whic

Nifty to start a new rally after crossing 5950...

From past nine months after making an important pivot low of 4770 prices started to form higher high and higher low which is a health sign and precisely moving in a rising channel. The overall structure looks positive for Nifty and can move higher from this levels. Nifty resisted to 5950 for many trading sessions and opened with a gap up, thus crossing the important level of 5950. Now 5950 followed by 5840 will act as an crucial support for Nifty to achieve 6150 level. Again minor supports are  placed at 5980 levels which can be utilized as a stop loss for intraday trading. Nifty opened with gap up for consecutive 2 days and moved in a sideways direction in the entire day. This was previously happened in April 2011 where Nifty opened with a gap up twice and moved up more than 500 points. Moving Averages  20 EMA and 50 SMA is positively poised  as 20 EMA is still above 50 SMA. Momentum Indicator RSI has exhibited negative divergence and we are cautiously positive for Nifty. Any m

JPYINR to move down in coming trading sessions....

JPYINR is negatively poised as it moving in a down ward sloping channel. The currency pair is forming lower high and lower low from November 2012. Prices were hovering near the resistance of upper trend line of falling channel on Friday. It opened negative after facing the resistance and made a low of 63.60 level. As per wave perspective, prices are moving in a double zigzag pattern (a-b-c-x-a-b-c). Currently prices are moving lower in the form of wave c. In short, our bias for JPYINR continues to be negative as far as prices are moving in a downward sloping channel.

USDINR to test 55.30 level...

USDINR: USDINR in daily charts has closed near the high of the previous day around 55. For further positive confirmation USDINR need to close above 55.13 for further upmove. Currently it is moving in a sideways direction within a stiff range of 55-54.20. A close above 55.13 will breach the resistance of 50% of the retracement of the previous upmove (57-54.20) which will push prices to 55.30 levels which is 61.8% of the retracement. The scenario is different as compared to previous month in this pair as wave counts are very tricky and we have to rely on basic technical tools and support levels. In short, our bias for USDINR is still positive as far as 54.20 is intact. Expect this currency pair to move upto 55.30 in coming trading sesions. GBPINR GBPINR has rallied in a positive direction and broke the range of 88.50-87 on the upside. Now as far 88.70 is intact expect an upside for this pair.  GBPINR is hovering near the previous top of 89.65. Currently pr

A clear direction for USDINR after a transition period...

USDINR: USDINR in daily charts has closed above the previous day high for consecutive two trading day’s which indicates that the trend is in a positive direction. RBI yesterday left Repo and CRR rate unchanged which had depreciated INR, as a result USDINR broke the stiff range of 54.80-54.20. Now 54.80 will act as a strong support and USDINR can move upto 55.30 which is 61.8% of the retracement of the previous down move (57-54.20) over short term. In short, our bias for USDINR is positive as far as 54.80is intact. Expect this currency pair to move upto 55.30 in coming trading sesions. GBPINR: On Tuesday GBPINR broke the range of 88.50-87 on the upside by breaking the upper extreme of 88.50 and closed at 89.40  GBPINR can test 89.65 in coming trading session, any move above 89.65 will make high after 6 years and will infuse buying pressure if crossed. Now 88.50 will act as crucia support and 89.65 as resistance In short, GBPINR is positively biased as i

USDINR continues to move sideways...

BOTTOM LINE: USDINR continues to move in sideways direction… USDINR: USDINR is moving in a range of 54.80-54.20 which clearly indicates that the currency pair is moving in a sideways direction. To get a clear direction USDINR need to obtain a confirmation which is possible by breaking the above mentioned range. After forming a top around 57, USDINR is moving in a corrective fashion. However, if 55.10 is taken out on the upside the sentiments will change and fresh longs will not be ruled out. As per wave perspective, after completing wave v, the currency pair started moving in a downtrend and completed wave b around 55.10. Currently prices are moving in the form of wave c. Any move above 55.10 will complete wave c on downside and next leg on the upside will start. A sideways movement in USDINR has also impacted NIFTY, as both are inversely related hardly any movement is been seen in last week. In short, any move below 54.20 will drag USDINR to 53.65-53.50 and